A Technical Site Audit
SEO has changed a lot in the last 10 years with the introductions of Panda and Penguin to name just two from the Google menagerie. If you are tasked with the SEO on a website, there are a number of things you can quickly and easily determine by looking at the site.
Things like:
- Is there keyword stuffing in the content and/or domain name.
- Is the web page real estate compatible with Google's page layout algorithm. A quick visual check can determine what is above the fold.
- Is the navigation system intuitive and helpful to the visitor? Is the site structure optimized in a logical way?
- Is the page the visitor sees the same as the one the search engine spiders?
- Are there site wide links that Google would frown upon?
- Is there any user-generated content (e.g. comments) that really should not be on a high-quality website?
- Is the content of the calibre found in expensive magazines?
- Do visitors to your site trust you? What signals are there on the site that increase trust?
- Are the relevant policies and disclaimers present?
Recently I started testing a tool called Site Visualizer Professional to see whether it could carry out the tasks of my technical audit. You can download a free 30 day trial of Site Visualizer from their website, so give it a go.
In the rest of this article, I want to take you through the audit process so you can see how this software works, and the level of technical detail it offers.
Crawling the Site
The first step in the technical audit is to crawl the website you are interested in. This is really easy, but there is one setting you need to enable because it is disabled by default.
1. Click New… from the toolbar.
2. Enter the URL of the site.
3. Add a description if needed.
4. Click on to the Crawling tab.

On the crawling tab, check the Count Word Number checkbox. This will collect data about the number of words on a page. It's not necessarily a very important metric, but it can alert you to “thin” pages.

Explore the other options on this screen by moving your mouse over the options. The help text at the bottom changes to explain what each option is for:

Something you might like to change is the User Agent. It is possible that some sites may block the Site Visualizer spider, so you can choose to make the software look like other well-known bots. Personally, if I am spidering my own sites, I'll use the Site-Visualizer user agent as I can then filter these out of my analytics. If I am spidering someone else's site, I'll use one of the others.

When done, click OK to accept your settings.
If you need to get back at any time to change these settings for a project, you can do so via the Project menu in the toolbar:

You are now ready to start the spidering process. Click the Start button in the toolbar:

You can follow the progress of the spider by looking at the information above the toolbar:

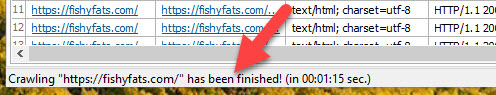
You will get a “finished” message in the toolbar at the bottom:
You'll see that the main screen is now populated with data from the website. Before we start the technical audit, let's just have a quick look at the interface.
Site Visualizer Pro Interface
WHen the site has been spidered, the main screen presents you with two tables of data.

Table 1 is a list of all URLs found on the site, with their associated data.
Table 2 is a list of all links to and from the URL that is selected in Table 1. These are divided into Out Links (links leaving the page) and In Links (links pointing to that page from the site).
Before continuing, I'd recommend you save your project. That way you will be able to open the project in the future without having to re-spider the whole site.
Response Codes
Response codes are three-digit numbers returned to the web browser when it tries to access a web page. The value of that response code tells us if the page is found OK, or there is a problem.
The response code 200 tells us the page was accessed without issue.
The response codes of 301 or 302 let us know that the page is being redirected to another URL.
A response code of 404 tells us the page was not found.
A response code of 500 means there is an internal error with the page.
So let's see how Site Visualizer Pro can help us identify problems using response codes.
The top table has a couple of columns relating to response codes:

You can order these columns by clicking the column headers. Doing so, shows me two 3xx response codes at the top of the table. The 302 is a login page for the site, so that is not something that is a concern. The 301 redirect is a redirect I setup for an affiliate product, so again, no problem there.
Looking through all of the URLs on my site, they all show a response code of 200 with the exception of the two we just spoke about.
The URLs we are looking at are all URLs belonging to my website. It is also a good idea to check URLs that my site link to. In other words, external links on the site. I can do this by checking the Show External box:

You can now see that the URLs in the list also include other web pages that my site links to.
On re-ordering the response code column, I can see that there are three 4xx response codes that tell me these links on my web pages are broken and need fixing.
At this point in the article, I want to introduce you to the Reports, which can provide a lot of important information all in one table.
Click onto the Reports tab and then double click the All Responses report. You'll get a summary of all response codes in a neat table:

You can see in the table that there are 3 URLs that are an issue. There is one with a 403 response code (forbidden access), and two with 404 response codes (page not found).
To get more details on these three URLs, double click the Clent Error Responses (4xx) report on the left. The results will populate in a table on the right.

The first three lines in this table refer to the same URL producing the 403 (forbidden) response code. The last 4 lines refer to the other two URLs.
Let's look at the 403 error. That URL is being linked to from three pages on my site.
- A blog post.
- The blog archive page.
- The author page.
Since 2 & 3 are there only because of the blog post, I only need to correct the blog post. If I right click on the blog post in the From URL column, I can open that page in a browser window to find the URL:

Here is the link causing issues:

If I click the link on my web page, it actually resolves to the correct URL on that site. That means the site is blocking the Site Visualizer Pro crawler. That's fine. I could try a different User Agent, but it's not really needed as I know that link is OK.
But what about the 404 error on line 4?

That from URL is the same as the To URL. How do I know the web page on my site that links to this URL?
Well fortunately, the External Out Links report comes to the rescue. Double-clicking on that to load the report will show me all external links on my site.
I can then pull up the Find dialogue box (CTRL+F) and search for the offending external link:

The first row matching my search will be highlighted in the report, showing me where that link is found on my site.

I can see that the link is found on a blog post and two archive pages (that simply list that post so include the URL). If I fix the blog post, it will fix the other two. Right clicking on the row with the blog post allows me to open the post in a browser, so I can find the link:

Clicking the link confirms that the destination page no longer exists, so I need to remove that link from my page to clear that 404.
So those are my own 4xx errors cleared up. If you have any other errors, go through them systematically and fix them all. It is also worth running the Blocked by robots.txt report to check that all pages that should be spidered, are.
Outbound Link Issues
One of the first things we did in this technical audit was to check the response codes of pages on our own site, to make sure all of our pages were working properly.
It is also important to check the response codes of web pages that we are linking to on other websites. We have just checked on problem outbound link in the last section using the External Out Links report. While we have that report open, we can do a full check of all external links by simply ordering the response codes column.

You can see that problem link from the last section right up there at the top.
You can also see every other URL we are linking out to that returns a 3xx or 4xx response code.
All 4xx response codes should be fixed. Find where you are linking to these pages and fix those links.
The 3xx response codes mean that the URL you are linking is redirecting to another URL. It may be that you specifically set up the redirect (as in the affiliate link I mentioned earlier), but for any link where you did not intentionally redirect the URL, I'd recommend you update the links so there is no redirect. Simply find out where the link is being redirected to, check it is the page you want to link to, then update the link on your site to remove the redirect.
Indexability
This check is to make sure that all of the content we want indexed in Google is visible to Google, and all content we want “hidden”, is.
To effectively hide content from Google, we use the noindex tag in the HTML of the page. That tells all search engines to ignore the page and not include it in the search results.
Go back to the Pages & Links tab, and find the column called Meta Robots. Click on it to order by that column. You may need to click twice to get the desired information at the top. Another thing you might like to do is drag & drop that column closer to the URL column so they are side-by-side:

I can now go down the list and confirm that all of the pages I want hidden are noindex. I'll also check all of the URLs to make sure that no page is incorrectly tagged with noindex.
To make things easier, Site Visualiser Pro allows you to create custom reports. I have created a custom report to show all URLs that are tagged as noindex. Running that report gives me this table that I can work from:

Server Response Time
The server response time is the length of time it takes a server to acknowledge a request to retrieve a resource. It's the length of time it takes for a web page to start downloading after you enter the URL in a web browser and hit return. For someone coming from Google, it's the time it takes for a web page to start downloading after they click the link in the search results. Do you get where I am going here?
If your server is slow to respond, it slows down the loading time of your web page.
Note that the server response time is not how long a web page takes to render. It is the time it takes to respond to a request so that the page can then be downloaded.
OK, so how can Site Visualiser Pro help?
Back on the Pages & Links tab, uncheck the Show External box so we are only looking at pages on your own website. Now select HTML from the content type drop down box.
You can now scroll across to the Response Time column and order it from large to small:

The first URL on that list is a 301 redirect I setup, so I am not interested in that.
The second URL is the login page of the WordPress dashboard, so again that isn't important.
What I am looking for is the first web page on the site that is important, and I can see that the server response time for that first post is 0.001. That's quick so nothing to worry about. All posts should have roughly the same response time, as we are measuring the server response which has nothing to do with the web page that is being requested.
If your server response time is long, then maybe you should look at your web hosting. If your host cannot speed that up, then I'd recommend you find a host that can provide low response times.
In Links
In Links are links pointing in to a web page. We all know that links equal votes when it comes to search engine ranking.
It therefore makes sense that the most important pages on your site will have the most links pointing to them from other pages on your site.
On the Pages & Links tab, make sure Content Type is set to HTML and Show External is unchecked. Now scroll across and find the Inlinks column. I have dragged mine across so that it is next to the URL column. Not click on the Inlinks column to order from high to low.

I can now see that the page on my site that has the most internal links is the blog category page. I need to decide if that is the most important page on my site, and fix things if necessary. Where is my homepage? Why isn't that the most linked to page? These are all questions I need to ask. From an SEO point of view, as things stand, what page on my site do you think Google will see as the most important? The homepage? The Blog category page?
While we are looking at this report, it is interesting to check the anchor text being used to link to my most important pages.
If I click on the blog category page in the Pages & Links table, then select the Inlinks tab from the bottom table, I can see details of all links pointing to that blog category page.

If I order by the anchor text column, I can get a clearer picture of the variation in anchor texts being used. Do I need to add more variations? Are all of the anchor texts valid and appropriate?
If I need to change anything, I can easily see which page the link appears on.
Word Count
Google hates “thin” pages. That is, pages with little or no useful content.
Site Visualizer Professional will allow you to order your URLs by word count. Note that you have to turn word count on in the project options before spidering the site. We saw this earlier in the article.
On the Pages & Links tab, scroll across to the Word Count column. Order from low to high by clicking the column header.

I can now quickly see pages that might be at risk of being “thin”.
I have my Meta Robots column next to the Word Count column because it allows me to quickly identify whether a page with low word count is important. None of the first 8 rows are, and row 9 is the next lowest word count with 541 words on the page. That's fine by me.
Word Count is not something I would rely on too heavily, since some short articles may be packed with great information, and a low word count may be all that is needed. Use the word count column as an indicator only, to bring your attention to potential issues.
Page Titles
The title length of your pages is important. Too long and it will be truncated in the search results. To short and you are missing an opportunity of getting someones interest.
As a general rule, I like to check that titles are between 30-60 characters.
I also like to check that titles are unique and the same title is not used on multiple web pages.
Duplicate Title Check
Let's do the duplicate check first, as that report is built into Site Visualiser Pro.
On the Reports tab, double click the Title Occurrences report found inside the Pages reports. When the report loads, click on the Occurrences column to order from high to low.

I know have a quick visual check to see whether a title appears on more than one page.
The top URL is my affiliate link 301 redirect. It's not a page so doesn't have a title tag. That is why there is no title in the table.
There are then 5 pages on my site that have the same title. These pages are author archive pages, so those pages are auto-generated by WordPress. It would be useful to know if these pages were being indexed by Google, so I created my own custom report to show me pages where the title has been used more than once, but included the meta robots column. Here are those results:

So none of the URLs are being indexed anyway, and wont cause us any problems in Google.
If you do have URLs with duplicate titles, and those URLs are being indexed and included in Google, you should fix them. All titles of indexable pages should be unique.
Title Length Check
On the main Page & Links tab, you have a title length column, so can order your titles by length. This will give you a quick way of determining if a title is too long or too short.

For my own use, I have created two custom reports. One checks to see if the title is too short, and the other checks if the title is too long. Here is the report for titles that may be too long:

Using that report, I can quickly see which titles are in danger of truncation at Google and fix them.
My report showing titles that may be too short looks like this:

Note that I have included the meta robots information with this report, as it quickly tells me which titles I can ignore.
Meta Descriptions
For best practices:
- Web pages should have a meta description tag that is between 70 – 155 characters.
- No two web pages should have the same meta description.
OK, so let's check these things with Site Visualizer.
For checking the description length, go back to the Pages & Links tab, and look for the Description Length column. Order by that column to check for pages with descriptions that fall outside the 70-155 character guidelines.
To check if a meta description has been used on multiple pages, there is a Description Occurrences report in the Pages section of reports. This shows you a count of each meta description so you can spot duplicates.
For my own work, I created custom reports that show me all of this information.
My first report is checks for duplication of meta description tags and looks like this:

My next report checks for missing meta description tags and includes the meta robots tag, making it easy to go in and find those pages that should have one.

Then of course I have two final reports that show pages with too short (excluding missing meta descriptions which are found in the previous report but with meta robots information to help identify pages that need editing), and too long meta description tags. Here is the report showing long meta description tags:

Meta Keywords
I don't actually recommend you use Meta Keywords. They won't help you rank any better and could just help identify you as a spammer if they are abused.
However, during a site audit, I do check meta keywords for two reasons:
- To check that if meta keywords are being used, they are being used responsibly.
- To check what keywords my competitors think are important.
You don't need any custom report to check this information. You can easily check Meta Keywords on your site by looking for the Meta Keywords and Keywords Length columns and ordering by those.
If keywords are being used on the pages you are analyzing, pay particular attention to the keywords Length column as this can highlight potential spammy use of the keywords meta tag.
H1 - H6 Headers
There are a few checks I like to make on the headers used on a web page.
Here is my check list:
- Make sure all pages have a single H1 header. For SEO reasons, pages should only have one H1 header, in the same way a newspaper article only has one main heading at the top. Some WordPress themes actually use an H1 header for the site name at the top, which isn't a great idea. The H1 header should be the title of the web page.
- Make sure all headers are unique. Duplication is bad, and couldn't get much worse than an H1 header that is being used on more than one page of the site. This test checks this.
- Make sure all headers (H1 – H6) are between 20 – 70 characters. If headers are too short, then you are wasting characters that could be used to convince potential visitors your article is worth reading. If your headers are too long, it not only looks ridiculous but will also raise concerns of keyword stuffing. I like to keep a close eye on header length.
1. All Pages have one H1 header
I am a big believer in the SEO benefits of the H1 header. The H1 header is there to tell your visitor what the page is about. As such, Google takes more notice of this tag, so pages without a valid, finely crafted H1 header are missing a trick. I use a report in Site Visualizer Pro to show me all pages that do not contain an H1 header. This then gives me the opportunity to carefully look at those pages and decide if I need to add an H1 header. Obviously I am not interested in pages that are noindex, so I ignore those.

2. H1 Headers are Unique
I have created a report that filters out all H1 headers on the website. These are then ordered by heading text. I can then look down the list to see if any two or more successive headings are identical, and if that is a problem

You can see in the screenshot that there is one instance where an H1 header is duplicated, however, this is not a problem because these are blog category archive pages 1 and 2.
3. Header Length is between 20 - 70 characters
I have created a report that shows me H1 headers smaller than 20 characters or larger than 70 characters. This then highlights all H1 headers that may need to be looked at.

It's a simple case of going through these headers and crafting more appropriate headers where needed. The report gives me the URL of the page so it is easy enough to find and edit these pages.
Images
Images make web pages look better and the saying “an image is worth a thousand words” is particularly apt when it comes to the web. But there are some checks I like to make on the images used on my own sites. These are:
- Find images over 100Kb – do they need to be so big as they can slow down the load times of the pages.
- Find images with missing ALT text. ALT text is there to improve the experience for visually impaired users, and should be used to concisely define what the picture is about. These ALT tags descriptions can be read aloud using text to voice software.
- Find images with ALT text that is too long. Long ALT tags are unnecessary for their purpose. If you use long ALT tags, then these may come under closer scrutiny by the search engines to see if they are being abused and keyword stuffed.
Images Over 100Kb
Double clicking on this report will list all images over 100Kb in size. It is then up to you as webmaster to decide whether big images need to be as big, or can be reduced to maximize download times. Here is what the report looks like:

As you can see, the report contains the URL where the image is found plus the image URL and size.
Images Missing ALT tags
This report shows you the URL where the image is found and the image URL.

Long ALT Tags
This report shows any images that have ALT tags over 120 characters in length. The accepted maximum size of an ALT tag is 125 characters because of screen reader software. That should be plenty of characters to provide a description of the image.
Since I dont have any images with super long ALT tags to show you, my report is blank, but contains the URL where the image is found, the image URL, and the ALT tag.

Where to go from here?
I haven't shown you the full capability of Site Visualizer Professional. I would recommend you have a look through the pre-defined reports that come with the tool and see what information they offer. If you want to get technical, you can also have a look at the SQL code behind each report and even edit them.
If you are confident, create your own reports using the existing report SQL as a starting point.
Note about the custom reports used in this tutorial
Site Visualizer Professional reports are powered by SQL. If you know how to program in SQL, you can create your own custom reports. As a special offer, I am offering the reports I have created to anyone that buys Site Visualizer Professional through my affiliate link.
Use the link below (one link is for single user license, the other is for a company license), and then send me confirmation of your purchase. After I verify that the purchase was made through my link, I will send you my custom reports.
Affiliate Disclaimer: Please note that if you do buy through my affiliate link, I do get a small commission. However, you pay the same price whether you buy through my link, or not.